普通视图

发现新文章,点击刷新页面。
昨天以前hanjm's Blog

深入理解Prometheus(GO SDK及Grafana基本面板)

作者 hanjm
2019年10月6日 00:00

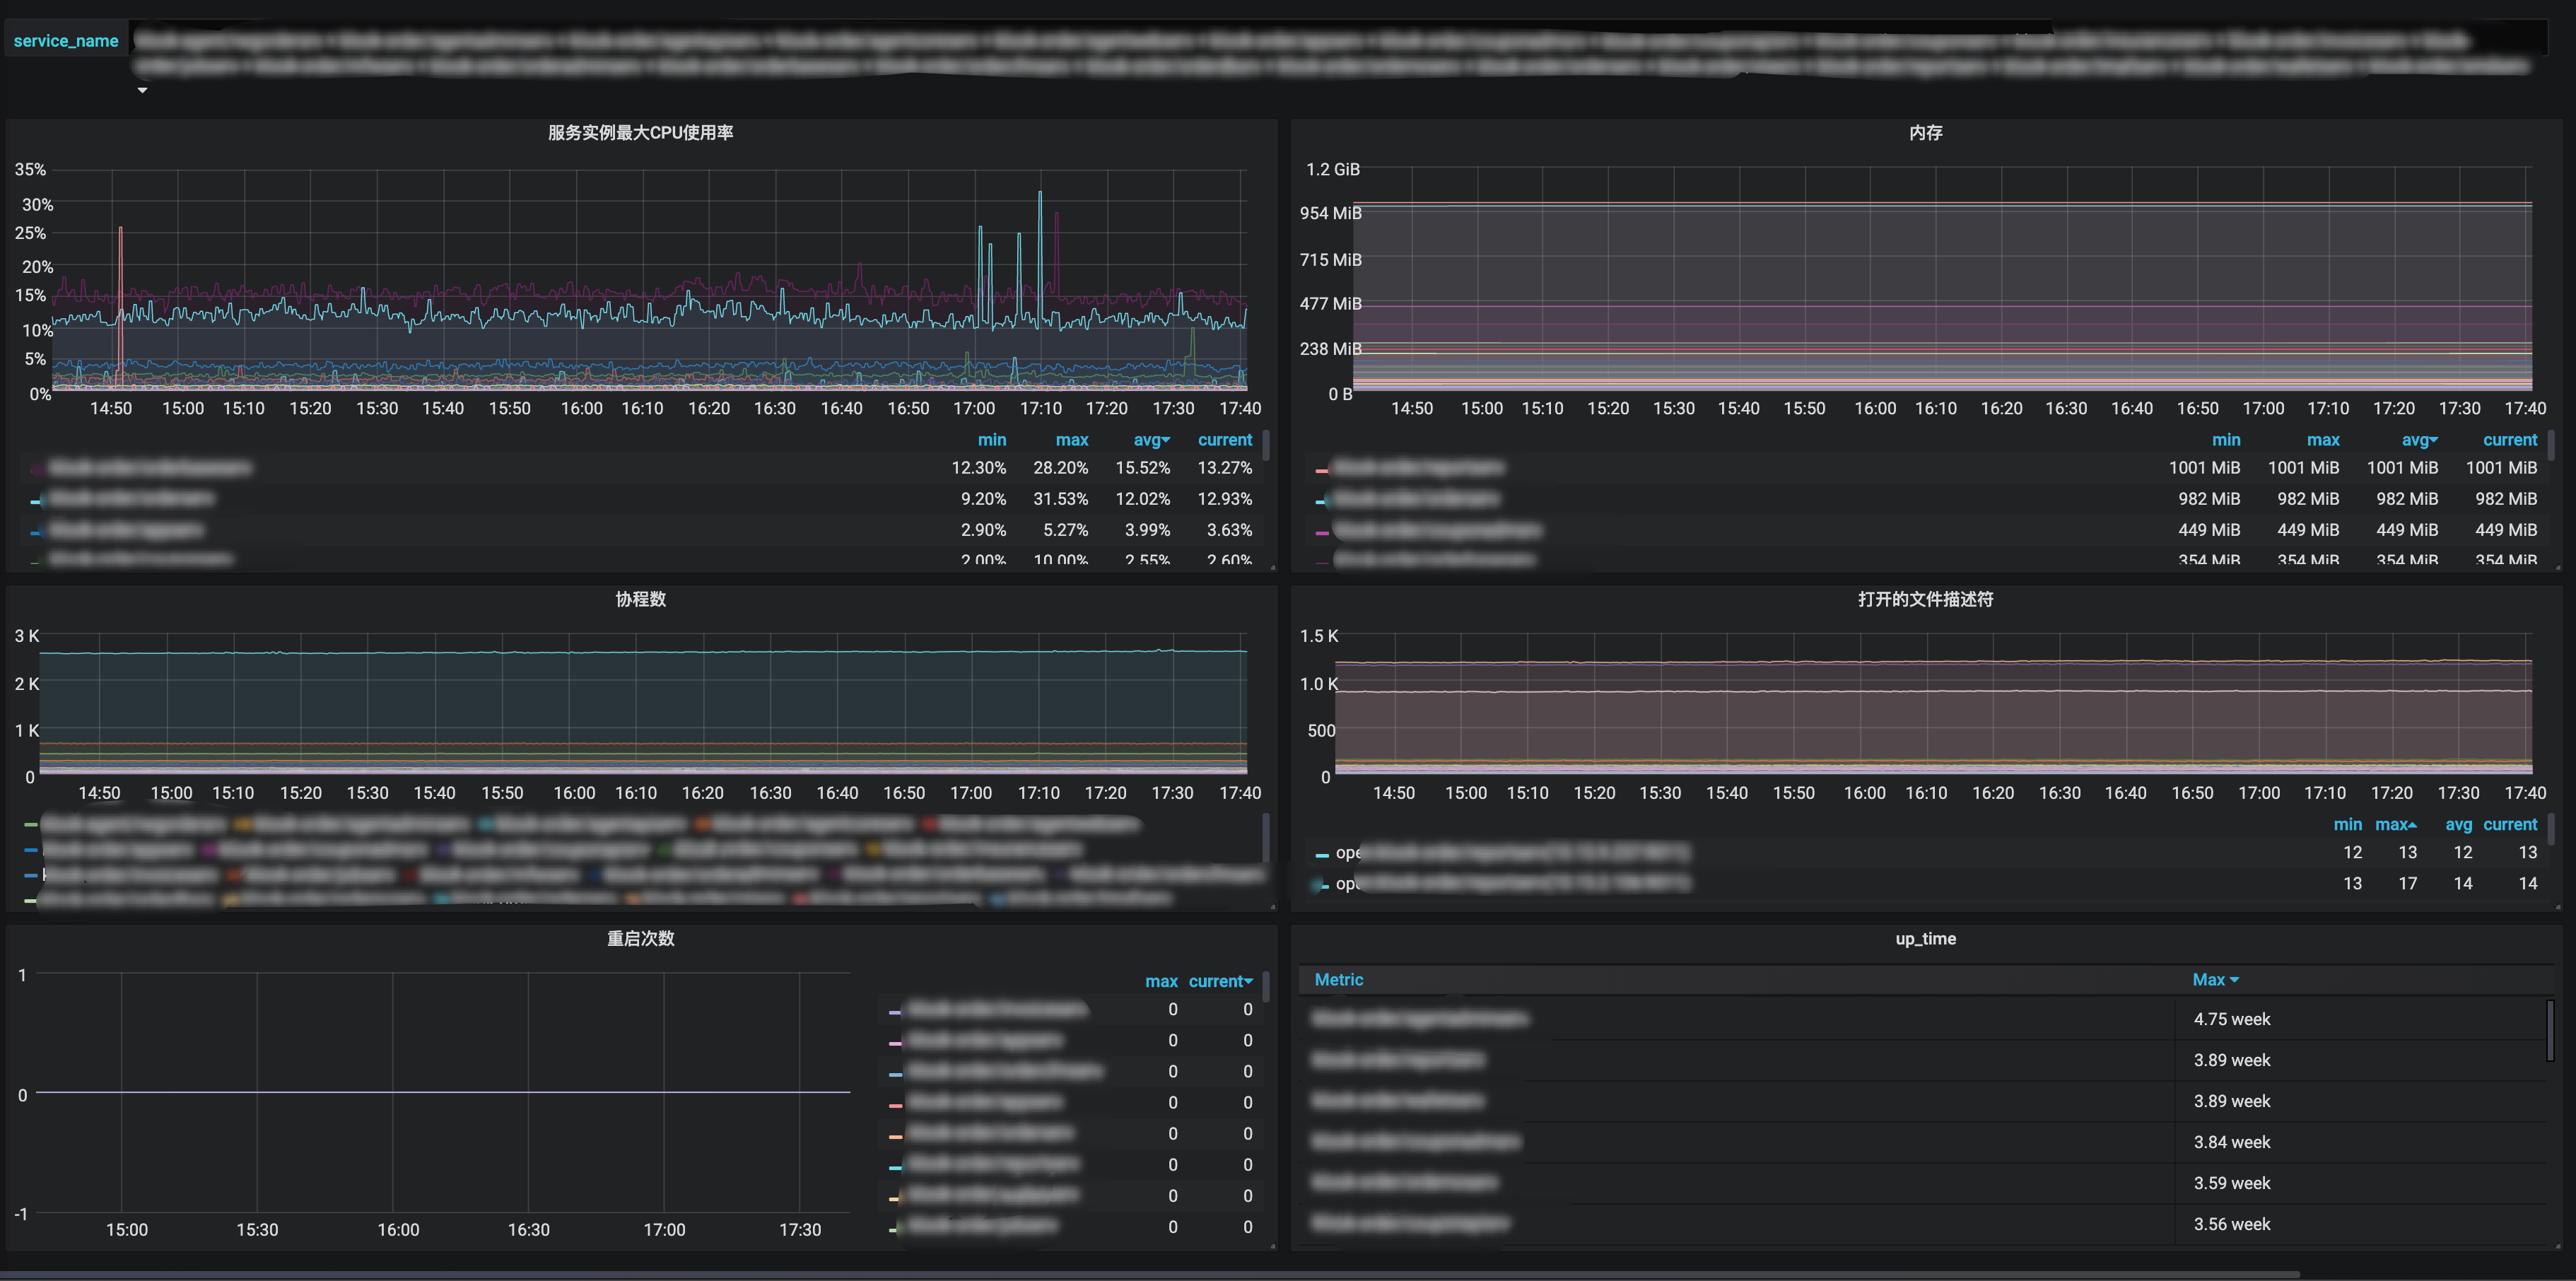
最近我对Prometheus刮目相看了, 服务加一行代码就能轻轻松松地监控起来服务的CPU使用率、内存、协程数、线程数、打开的文件描述符数量及软限制、重启次数等重要的基本指标, 配合Grafana建立了直观的图表, 对查问题很有帮助, 故想写写折腾Prometheus和Grafana后得到的值得一讲的实践与理解.

GO服务几个重要的基本指标Dashboard

介绍

Prometheus是CNCF 的项目之一(ps.CNCF的项目代码都值得研究), 而且还是Graduated Projects. 同时因为其主要是方便灵活的pull方式, 暴露出个http接口出来给prometheusd拉取就行了, 而push方式客户端要做更多的事情, 如果要改push的地址的话就很麻烦, 所以很多著名的项目都在用它, 比如k8s, tidb, etcd, 甚至是时序数据库influxdb都在用它.

我体会到, 很多场景很适合使用Prometheus sdk去加一些指标, 比如logger包, Error级别的消息数是一个很有用的指标; 对于消息队列的SDK, 可以用Prometheus收集客户端侧的发送时延、消费时延、消费处理耗时、消费处理出错等指标; 封装DB操作的SDK, 连接池打开的DB连接数与最大连接数是个很重要的指标; 写个HTTP Middleware, http handler的调用次数、处理时间和responseCode是感兴趣的指标.

安装

Prometheus是Go写的, 故部署方便且跨平台, 一个二进制文件加配置文件就能跑起来.

GitHub release页面有各个平台的编译好的二进制文件,通常配合supervisor等进程管理工具来服务化, 也可以用docker.

文档上有基础的配置文件示例, 复制为prometheus.yml即可.

./prometheus --config.file=prometheus.yml

prometheus.yml主要是定义一些全局的抓取间隔等参数以及抓取的job, 抓取的job可以指定名字、抓取间隔、抓取目标的IP端口号列表, 目标的路由路径, 额外的label等参数.

抓取指标时会自动加上job="<job_name>"instance="<target ip port>"两个label, 如果想给job添加额外的固定label, 则可以在配置文件中按如下语法添加.

scrape_configs:
- job_name: foo
metrics_path: "/prometheus/metrics"
static_configs:
- targets: ['localhost:10056']
labels:
service_name: "bar"

服务发现

前面说到, Prometheus的配置文件主要就是定义要抓取的job配置, 显然新加服务要改配置文件是比较麻烦的, Prometheus的一大重要的功能点就是原生支持多种服务发现方式, 支持consul etcd等服务发现组件, 还支持非常通用的基于文件的服务发现, 即你可以定义一个写好target的IP端口号等配置的配置文件路径, 由外部程序定期去更新这个文件, prometheus会定期加载它, 更新抓取的目标, 非常灵活.

数据描述

Prometheus的时序指标数据由timestamp、metric name、label、value组成:

  • timestamp是毫秒级的时间戳.

  • metric name是符合正则[a-zA-Z_:][a-zA-Z0-9_:]*的字符串, 即只包含英文字母和数字及两个特殊符号_:, 不能包含横杆-这样的特殊符号.

  • label是一个kv都是string类型的map.

  • value是float64.

指标类型

Prometheus的指标类型包括基本指标类型Counter和Guage及进阶指标类型Historygram和Summary.

所有指标都是在client SDK端内存存储的, 由prometheus抓取器抓取.

Counter

Counter是计数器, 单调递增的, 只有服务重启时才会清零, 比如http请求数, errorLevel的log数. 值得一提的是, prometheus的内置函数求值时会自动处理重启清零的情况.

counter的value是float64, 怎么无锁地操作float64呢? 答案是用math包将其视作uint64来操作.

func (v *value) Add(val float64) {
for {
oldBits := atomic.LoadUint64(&v.valBits)
newBits := math.Float64bits(math.Float64frombits(oldBits) + val)
if atomic.CompareAndSwapUint64(&v.valBits, oldBits, newBits) {
return
}
}
}

Guage

Guage是一个可增可减的数值指标, 比如CPU使用率, 内存使用率, 协程数.

Historygram

Historygram是直方图, 适合需要知道数值分布范围的场景, 比如http请求的响应时长, http请求的响应包体大小等.

直方图的组距不一定是固定的, 可以自己定义适合, 这里称其为bucket, 每一个metric value根据其数值大小落在对应的bucket.

Historygram实际上包含多个时序数据.

  • <basename>_bucket{le="<upper inclusive bound>"}小于等于指定数值的计数.
  • <basename>_sum 总和
  • <basename>_count 总计数, 其值当然也等于<basename>_bucket{le="+Inf"}

Summary

Summary相比Historygram是按百分位聚合好的直方图, 适合需要知道百分比分布范围的场景, 比如对于 http请求的响应时长, Historygram是侧重在于统计小于1ms的请求有多少个, 1ms~10ms的请求有多少个, 10ms以上的请求有多少个, 而Summary在于统计20%的请求的响应时间是多少, 50%的请求的响应时间是多少, 99%的请求的响应时间是多少. Historygram是计数原始数据, 开销小, 执行查询时有对应的函数计算得到p50, p99, 而Summary是在客户端SDK测做了聚合计算得到指定的百分位, 开销更大一些.

SDK的使用

prometheus的Golang SDK设计得很地道, 充分利用了GO语言的特性.

在SDK中所有的指标类型都实现了prometheus.Collector 接口.

// Collector is the interface implemented by anything that can be used by
// Prometheus to collect metrics. A Collector has to be registered for
// collection. See Registerer.Register.
//
// The stock metrics provided by this package (Gauge, Counter, Summary,
// Histogram, Untyped) are also Collectors (which only ever collect one metric,
// namely itself). An implementer of Collector may, however, collect multiple
// metrics in a coordinated fashion and/or create metrics on the fly. Examples
// for collectors already implemented in this library are the metric vectors
// (i.e. collection of multiple instances of the same Metric but with different
// label values) like GaugeVec or SummaryVec, and the ExpvarCollector.
type Collector interface {
// Describe sends the super-set of all possible descriptors of metrics
// collected by this Collector to the provided channel and returns once
// the last descriptor has been sent. The sent descriptors fulfill the
// consistency and uniqueness requirements described in the Desc
// documentation. (It is valid if one and the same Collector sends
// duplicate descriptors. Those duplicates are simply ignored. However,
// two different Collectors must not send duplicate descriptors.) This
// method idempotently sends the same descriptors throughout the
// lifetime of the Collector. If a Collector encounters an error while
// executing this method, it must send an invalid descriptor (created
// with NewInvalidDesc) to signal the error to the registry.
Describe(chan<- *Desc)
// Collect is called by the Prometheus registry when collecting
// metrics. The implementation sends each collected metric via the
// provided channel and returns once the last metric has been sent. The
// descriptor of each sent metric is one of those returned by
// Describe. Returned metrics that share the same descriptor must differ
// in their variable label values. This method may be called
// concurrently and must therefore be implemented in a concurrency safe
// way. Blocking occurs at the expense of total performance of rendering
// all registered metrics. Ideally, Collector implementations support
// concurrent readers.
Collect(chan<- Metric)
}

prometheus.Collector 接口中的方法传参都是只写的chan, 使得实现接口的代码无论是同步还是并行都可以. Describe(chan<- *Desc)方法是在将Collector注册或注销时调用的, Collect(chan<- Metric)方法是在被抓取收集指标时调用的.

基本使用

不带label的指标类型使用prometheus.NewCounter prometheus.NewGauge prometheus.NewHistogram prometheus.NewSummary去创建并使用prometheus.MustRegister 注册, 一般是初始化好作为一个包内全局变量, 在init函数中注册.

var (
sentBytes = prometheus.NewCounter(prometheus.CounterOpts{
Namespace: "etcd",
Subsystem: "network",
Name: "client_grpc_sent_bytes_total",
Help: "The total number of bytes sent to grpc clients.",
})

receivedBytes = prometheus.NewCounter(prometheus.CounterOpts{
Namespace: "etcd",
Subsystem: "network",
Name: "client_grpc_received_bytes_total",
Help: "The total number of bytes received from grpc clients.",
})
)

func init() {
prometheus.MustRegister(sentBytes)
prometheus.MustRegister(receivedBytes)
}

counter的Add方法不能传负数, 否则会panic.

带label的指标类型使用prometheus.NewCounterVec prometheus.NewGaugeVec prometheus.NewHistogramVec prometheus.NewSummaryVec, 不同的label值就像空间直角坐标系中的以原点为七点的不同方向的向量一样.

调用Vec类型的WithLabelValues方法传入的value参数数量一定要和注册时定义的label数量一致, 否则会panic.

进阶使用

默认情况下, Collector都是主动去计数, 但有的指标无法主动计数, 比如监控服务当前打开的DB连接数, 这个指标更适合在拉取指标时去获取值, 这个时候就可以使用prometheus.NewCounterFunc prometheus.NewGaugeFunc, 传入一个返回指标值的函数func() float64, 在拉取指标时就会调用这个函数, 当然, 这样定义的是没有带Label的, 如果想在拉取指标时执行自己定义的函数并且附加上label, 就只能自己定义一个实现 prometheus.Collector接口的指标收集器, prometheus SDK设计得足够灵活, 暴露了底层方法MustNewConstMetric, 使得可以很方便地实现一个这样的自定义Collector, 代码如下.

type gaugeVecFuncCollector struct {
desc *prometheus.Desc
gaugeVecFuncWithLabelValues []gaugeVecFuncWithLabelValues
labelsDeduplicatedMap map[string]bool
}

// NewGaugeVecFunc
func NewGaugeVecFunc(opts GaugeOpts, labelNames []string) *gaugeVecFuncCollector {
return &gaugeVecFuncCollector{
desc: prometheus.NewDesc(
prometheus.BuildFQName(opts.Namespace, opts.Subsystem, opts.Name),
opts.Help,
labelNames,
opts.ConstLabels,
),
labelsDeduplicatedMap: make(map[string]bool),
}
}

// Describe
func (dc *gaugeVecFuncCollector) Describe(ch chan<- *prometheus.Desc) {
ch <- dc.desc
}

// Collect
func (dc *gaugeVecFuncCollector) Collect(ch chan<- prometheus.Metric) {
for _, v := range dc.gaugeVecFuncWithLabelValues {
ch <- prometheus.MustNewConstMetric(dc.desc, prometheus.GaugeValue, v.gaugeVecFunc(), v.labelValues...)
}
}

// RegisterGaugeVecFunc
// 同一组labelValues只能注册一次
func (dc *gaugeVecFuncCollector) RegisterGaugeVecFunc(labelValues []string, gaugeVecFunc func() float64) (err error) {
// prometheus每次允许收集一次labelValues相同的metric
deduplicateKey := strings.Join(labelValues, "")
if dc.labelsDeduplicatedMap[deduplicateKey] {
return fmt.Errorf("labelValues func already registered, labelValues:%v", labelValues)
}
dc.labelsDeduplicatedMap[deduplicateKey] = true
handlePanicGaugeVecFunc := func() float64 {
if rec := recover(); rec != nil {
const size = 10 * 1024
buf := make([]byte, size)
buf = buf[:runtime.Stack(buf, false)]
logger.Errorf("gaugeVecFunc panic:%v\nstack:%s", rec, buf)
}
return gaugeVecFunc()
}
dc.gaugeVecFuncWithLabelValues = append(dc.gaugeVecFuncWithLabelValues, gaugeVecFuncWithLabelValues{
gaugeVecFunc: handlePanicGaugeVecFunc,
labelValues: labelValues,
})
return nil
}

最佳实践

  1. 在编辑图表写查询语句时,不会显示指标类型, 所以最好看到metric name就能知道是一个什么类型的指标, 约定counter类型的指标名字以_total为后缀.

  2. 在编辑图表写查询语句时, 也不会显示指标类型的单位, 所以最好看到metric name就能知道是一个什么单位的指标, 比如时长要写是纳秒还是毫秒还是秒, http_request_duration_seconds, 数据大小要写是MB还是bytes, client_grpc_sent_bytes_total.

  3. 每个指标要有单个词的namespace前缀, 比如process_cpu_seconds_total, http_request_duration_seconds.

  4. 不带label的Counter和Guage内部是个无锁的atomic uint64, 不带Label的Historygram内部是多个无锁的atomic uint64, 不带Label的Summary因为内部要聚合计算, 是有锁的, 所以并发要求高的话优先选择Historygram而不是Summary.

  5. 带label的每次会去计算label值的hash找到对应的向量, 然后去计数, 所以label数不要太多, label值的长度不要太长, label值是要可枚举的并且不能太多, 否则执行查询时慢, 面板加载慢, 存储也费空间. label如果可以提前计算则尽量使用GetMetricWithLabelValues提前计算好得到一个普通的计数器, 减少每次计数的一次计算label的hash, 提升程序性能.

    // GetMetricWithLabelValues replaces the method of the same name in
    // MetricVec. The difference is that this method returns a Counter and not a
    // Metric so that no type conversion is required.
    func (m *CounterVec) GetMetricWithLabelValues(lvs ...string) (Counter, error) {
    metric, err := m.MetricVec.GetMetricWithLabelValues(lvs...)
    if metric != nil {
    return metric.(Counter), err
    }
    return nil, err
    }
  6. 对于时长time.Duration数据类型的指标值收集, time.Since是优化过的, 直接走runtimeNano, 无需走系统调用取当前时间, 性能优于time.Now后相减, 另外, 频繁调用time.Now在性能要求高的程序中也会变成不小的开销.
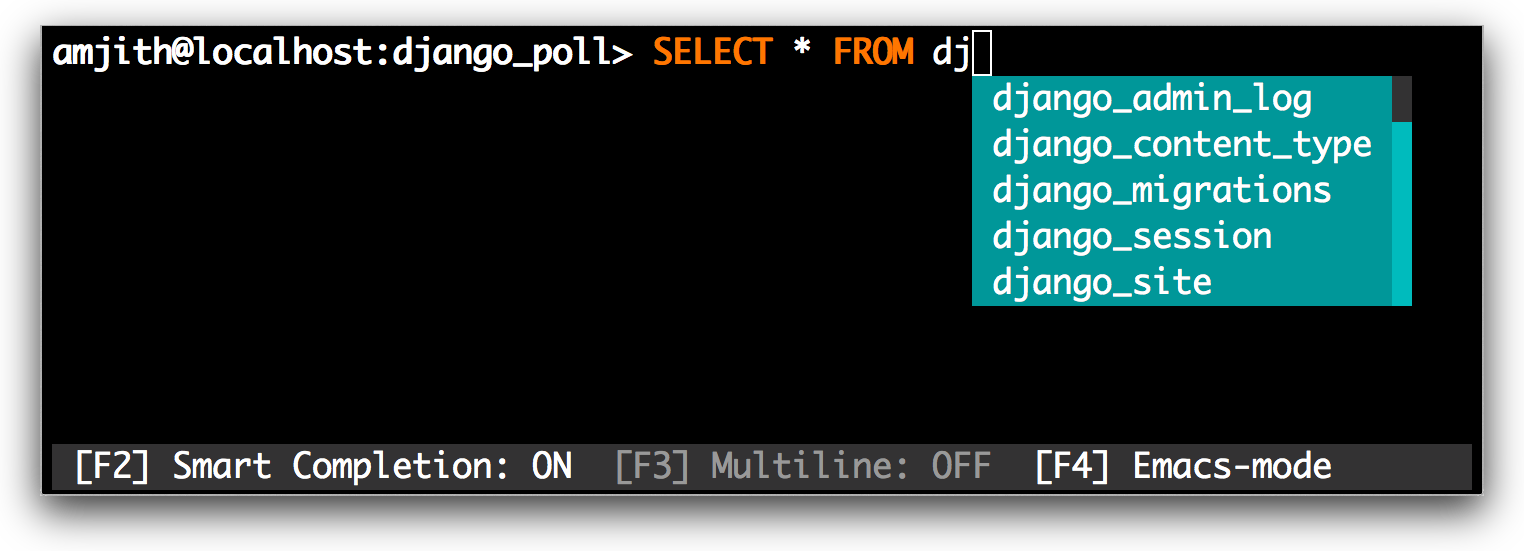
查询语句promQL

Prometheus查询语句(PromQL)是一个相比SQL更简单也很有表达力的专用查询语言, 通过文档及例子学习.

Prometheus自带的Graph面板比较简陋, 一般情况下直接用强大的Grafana就行了, 制作图表dashboard时, 直接输入PromQL即可展示时序图表.

label条件 (Instant vector selectors)

http_requests_total{job="prometheus",group="canary"}

查询条件中,除了=和!=外, =~表示正则匹配, !~表示正则不匹配.

查询条件也可以作用在metric name上, 语法有点像Python的__前缀的魔法, 如用 {__name__=~"job:.*"}表示选择名字符合job:.*这样的正则的metric.

范围条件(Range Vector Selectors)

http_requests_total{job="prometheus"}[5m]

范围条件中, 时长字符串语法和GO一样, s代表秒, m代表分, h代表小时, d代表天, w代表星期, y代表年.

常用函数

  1. changes() 变化次数
  2. delta(v range-vector) 平均变化量, 只适用于guage
  3. idelta(v range-vector) 即时变化量, 只适用于guage
  4. histogram_quantile(φ float, b instant-vector) histogram专用函数, 用来计算p99 p90等百分位的summary. 例子histogram_quantile(0.9, avg(rate(http_request_duration_seconds_bucket[10m])) by (job, le))
  5. increase(v range-vector) 增量, 只适用于counter
  6. rate - 平均QPS
  7. irate - 即时QPS, 如果原始数据变化快, 可以使用更敏感的irate

Snippet

这里列举一些我通过搜索及自行摸索出来的对于Prometheus GO SDK默认收集的指标的PromQL Snippet.

  1. CPU使用率: rate(process_cpu_seconds_total[1m])* 100

  2. 系统内存使用率: go_memstats_sys_bytes

  3. 重启次数: changes(process_start_time_seconds[5m])

Grafana面板

编辑Grafana面板时, 有几个技巧:

  1. Query界面可以设置下方说明条Legend的格式, 支持双花括号形式的模板语法, 此处的值在发报警时会作为报警消息内容的一部分.
  2. Visualization界面可以设置坐标轴的单位, 比如百分比, 数据大小单位, 时长单位等等, 让Y轴的值更具有可读性.
  3. Visualization界面可以设置Legend的更多选项, 是否显示为一个表格, 表格是放在下方还是右方, 支持显示额外的聚合值如最大值最小值平均值当前值总值, 支持设置这些聚合值的小数位数.

监控告警

告警在Grafana处可视化界面设置会比较简单, 可设置连续多少次指定的promQL查出的值不在指定的范围即触发报警, 告警通知的最佳搭配当然是slack channel.

Go sql.Driver的mysql Driver 中的一个有意思的行为

作者 hanjm
2018年11月29日 00:00

如果参数中没有参数, 则直接query.
如果sql中有参数, 且打开了InterpolateParams开关, 那么就客户端直接拼参数到SQL里, 不需要prepare直接query.
如果sql中有参数, 且没有打开InterpolateParams(默认设置), 且带参数, 就会走先prepare再发query参数两步.

github.com/go-sql-driver/mysql/connection.go:370
func (mc *mysqlConn) query(query string, args []driver.Value) (*textRows, error) {
//...
if len(args) != 0 {
if !mc.cfg.InterpolateParams {
return nil, driver.ErrSkip
}
// try client-side prepare to reduce roundtrip
prepared, err := mc.interpolateParams(query, args)
if err != nil {
return nil, err
}
query = prepared
}
// Send command
err := mc.writeCommandPacketStr(comQuery, query)
if err == nil {
// Read Result
// ...

后续再补篇文章详细写写sql.Driver

学习Influxdb

作者 hanjm
2018年11月18日 00:00

最近要实现接口监控, 准备用主流的时序数据库influxdb.

基本概念

influxdb的库也 database, 概念和mysql一样
influxdb的表叫 MEASUREMENTS, 意义更贴切, 测量的复数形式.
influxdb的一行数据叫 point, 就像做物理实验的打点, 每个点有其值和属性
influxdb的字段分类为 tag 和 field, field就是值, tag是其属性. 拿接口来说, 字段有 service_name, instance_id, method, handler_name, method, request_url, response_code, content_length, response_size, duration. 显然, 前面7个字段是tag, 特点是一般不是数值变量, 可枚举的, 所以influxdb对tag加了索引. 后面3个是field, 是数值变量, 是范围变化的, 不需要加索引.

插入数据

对于插入数据, influxdb同时提供了单条和批量插入的API. 开始不知道有批量方式, 来一条插一条, influxdb CPU巨高. 后面在官网文档找到了办法, 改用批量插入, 大大降低了CPU占用, 官方推荐是5k~1w条数据一批.

https://docs.influxdata.com/influxdb/v1.7/concepts/glossary/#batch

InfluxData recommends batch sizes of 5,000-10,000 points,
although different use cases may be better served by significantly smaller or larger batches.

influxdb同时提供了HTTP接口和UDP接口. UDP的好处在于减少了HTTP头部的开销, 性能更好

常用命令

  1. # 创建数据库
    CREATE DATABASE "db_name"
    # 显示所有数据库
    SHOW DATABASES
    # 删除数据库
    DROP DATABASE "db_name"
    # 使用数据库
    USE mydb
  2. # 显示该数据库中的表
    SHOW MEASUREMENTS
    # 创建表, 插入数据时会自动创建
    # 删除表
    DROP MEASUREMENT "measurementName"
  3. 查看数据保留策略 retention polices

    SHOW RETENTION POLICIES ON "testDB"
  4. 创建新的Retention Policies并设置为默认值

    # DURATION 保留多少天
    # REPLICATION 副本数
    CREATE RETENTION POLICY "rp_name" ON "db_name" DURATION 30d REPLICATION 1 DEFAULT

连续查询

# 创建一个连续查询, 每10秒计算一个接口响应耗时平均值到新表
CREATE CONTINUOUS QUERY cq_http_handler_stats_duration ON statsdb BEGIN SELECT mean("duration") INTO http_handler_stats_average_duraion_10s FROM http_handler_stats GROUP BY time(10s) END

# 如果成功创建, 那么过了第一个周期后, SHOW MEASUREMENTS 能看到多了一张表

# 显示创建的连续查询
SHOW CONTINUOUS QUERIES

# 删除
DROP CONTINUOUS QUERY cq_http_handler_stats_duration ON statsdb

图表

grafana 是 influxdb 的良好伴侣, 写个query语句就能得到很炫酷的图形. 比如接口请求量图表按handler_name, response_code, time(10s) group by就得到了.

GRPC文档阅读心得

作者 hanjm
2018年10月6日 00:00

主要是两个文档, grpc repo的文档 https://github.com/grpc/grpc/tree/master/doc , grpc-go repo的文档 https://github.com/grpc/grpc-go/tree/master/Documentation.

grpc-go 文档


gRPC Server Reflection Tutorial

在代码中import "google.golang.org/grpc/reflection"包, 然后加一行代码reflection.Register(s), 就可以启用 server reflection. 就可以用grpc_cli去进行获得服务列表, 方法列表, message结构体定义了. reflection.Register(s)实际上是注册了一个特殊的service, 它能列出server中已注册的服务和方法等信息.

Compression

encoding.RegisterCompressor方法取注册一个压缩器, 启用了压缩的话, 服务端和客户端双方都要进行同样的处理, 服务端在newServer时要带上compressor的serverOption, 客户端在dail的时候要带上WithDefaultCallOptions的DialOption, DialOption加上压缩解压的处理, 不然会得到一个 Internal error, 和HTTP方式一样, 压缩类型体现在content-type的header上.

Concurrency

Dial得到的ClientConn是并发安全.
stream的读写不是并发安全的, sendMsg或RecvMsg不能在多个goroutine中并发地调用,但可以分别在两个goroutine中处理send和Recv.

Encoding

序列化反序列化

自定义消息编码解码, 注册一个实现 Codec 接口的对象即可, 然后在Dial或Call时带上grpc.CallContentSubtype这个CallOption, 这样就可以自动处理这个带这个content-type的请求. 默认为 proto

压缩解压缩

自定义压缩解压缩, 注册一个实现 Compressor接口的对象即可, 然后在Dial或Call时带上grpc.UseCompressor这个CallOption.

[Mocking Service for gRPC

](https://github.com/grpc/grpc-go/blob/master/Documentation/gomock-example.md)

主要讲如何在单元测试中mock, 用gomock命令行生成实现xx接口的代码, 没什么特别的

[Authentication

](https://github.com/grpc/grpc-go/blob/master/Documentation/grpc-auth-support.md)

主要讲如何进行身份验证, 没什么特别的

Metadata

metadata类似HTTP1中的header, 数据结构都是一样的type MD map[string][]string,
key都是大小写不敏感的, 但实现规范和HTTP1不一样, HTTP1是按单词之间用连字符”-“分隔, 每个单词第一个字母大写这样的规范来的, 处理起来消耗更大, 而metadata是全转为小写, 实际使用过程中, 提前规范化key能提高不必要的strings.ToLower调用.
用-bin结尾的来传递二进制数据.

服务端handler用metadata.FromIncomingContext(ctx)拿到metadata, 客户端用metadata.AppendToOutgoingContext来附加kv到ctx中.

如果服务端handler又想附加一些信息返回client, 那么就要通过header和trailer传递, 类似responseHeader.

func (s *server) SomeRPC(ctx context.Context, in *pb.someRequest) (*pb.someResponse, error) {
// create and send header
header := metadata.Pairs("header-key", "val")
grpc.SendHeader(ctx, header)
// create and set trailer
trailer := metadata.Pairs("trailer-key", "val")
grpc.SetTrailer(ctx, trailer)
}

然后客户端在调用的时候传要保存的header和trailler的指针到CallOption中, 调用完后指针指向的metadata map就有数据了, 坦率地讲, 我觉得这样处理很麻烦.

var header, trailer metadata.MD // variable to store header and trailer
r, err := client.SomeRPC(
ctx,
someRequest,
grpc.Header(&header), // will retrieve header
grpc.Trailer(&trailer), // will retrieve trailer
)

// do something with header and trailer

Keepalive

gRPC会定时发http2 ping帧来判断连接是否挂掉, 如果ping没有在一定时期内ack, 那么连接会被close.

Log Levels

grpc-go包默认用gpclog包打日志, grpclog包默认是用多个*log.Logger来实现日志级别, 默认输出到stderr, 对于生产环境, 肯定要集成到自己的日志流里去, 接口是个好东西, grpclog包允许setLog, 实现grpclog.LoggerV2接口即可.

info日志包括:

grpclog里的info是为了debug

  • DNS 收到了更新
  • 负载均衡器 更新了选择的目标
  • 重要的grpc 状态变更

    warn日志包括:

    warning日志是出现了一些错误, 但还不至于panic.
  • DNS无法解析给定的target
  • 连接server时出错
  • 连接丢失或中断

    error日志包括:

    grpc内部有些error不是用户发起的函数调用, 所以无法返回error给调用者, 只能内部自己打error日志
  • 函数签名没有error, 但调用方传了个错误的参数过来.
  • 内部错误.

    Fatal日志:

    fatal日志是出现了不可恢复的内部错误, 要panic.

grpc 文档


之前一直有个误区, 多个连接比单个连接要快, 看了 grpc-go issues1grpc-go issues2 以及 HTTP2文档 才发现, 由于HTTP2有多路复用的特性, 对于同一个sever, 只需要维护一个连接就好了, 没有必要用多个连接去并行复用数据流. 连接数量减少对提升 HTTPS 部署的性能来说是一项特别重要的功能:可以减少开销较大的 TLS 连接数、提升会话重用率,以及从整体上减少所需的客户端和服务器资源。

深入理解GO时间处理(time.Time)

作者 hanjm
2017年10月29日 00:00

1. 前言

时间包括时间值和时区, 没有包含时区信息的时间是不完整的、有歧义的. 和外界传递或解析时间数据时, 应当像HTTP协议或unix-timestamp那样, 使用没有时区歧义的格式, 如果使用某些没有包含时区的非标准的时间表示格式(如yyyy-mm-dd HH:MM:SS), 是有隐患的, 因为解析时会使用场景的默认设置, 如系统时区, 数据库默认时区可能引发事故. 确保服务器系统、数据库、应用程序使用统一的时区, 如果因为一些历史原因, 应用程序各自保持着不同时区, 那么编程时要小心检查代码, 知道时间数据在使用不同时区的程序之间交换时的行为. 第三节会详细解释go程序在不同场景下time.Time的行为.

2. Time的数据结构

go1.9之前, time.Time的定义为

type Time struct {
// sec gives the number of seconds elapsed since
// January 1, year 1 00:00:00 UTC.
sec int64

// nsec specifies a non-negative nanosecond
// offset within the second named by Seconds.
// It must be in the range [0, 999999999].
nsec int32

// loc specifies the Location that should be used to
// determine the minute, hour, month, day, and year
// that correspond to this Time.
// The nil location means UTC.
// All UTC times are represented with loc==nil, never loc==&utcLoc.
loc *Location
}

sec表示从公元1年1月1日00:00:00UTC到要表示的整数秒数, nsec表示余下的纳秒数, loc表示时区. sec和nsec处理没有歧义的时间值, loc处理偏移量.

因为2017年闰一秒, 国际时钟调整, Go程序两次取time.Now()相减的时间差得到了意料之外的负数, 导致cloudFlare的CDN服务中断, 详见https://blog.cloudflare.com/how-and-why-the-leap-second-affected-cloudflare-dns/, go1.9在不影响已有应用代码的情况下修改了time.Time的实现. go1.9的time.Time定义为

// A Time represents an instant in time with nanosecond precision.
//
// Programs using times should typically store and pass them as values,
// not pointers. That is, time variables and struct fields should be of
// type time.Time, not *time.Time.
//
// A Time value can be used by multiple goroutines simultaneously except
// that the methods GobDecode, UnmarshalBinary, UnmarshalJSON and
// UnmarshalText are not concurrency-safe.
//
// Time instants can be compared using the Before, After, and Equal methods.
// The Sub method subtracts two instants, producing a Duration.
// The Add method adds a Time and a Duration, producing a Time.
//
// The zero value of type Time is January 1, year 1, 00:00:00.000000000 UTC.
// As this time is unlikely to come up in practice, the IsZero method gives
// a simple way of detecting a time that has not been initialized explicitly.
//
// Each Time has associated with it a Location, consulted when computing the
// presentation form of the time, such as in the Format, Hour, and Year methods.
// The methods Local, UTC, and In return a Time with a specific location.
// Changing the location in this way changes only the presentation; it does not
// change the instant in time being denoted and therefore does not affect the
// computations described in earlier paragraphs.
//
// Note that the Go == operator compares not just the time instant but also the
// Location and the monotonic clock reading. Therefore, Time values should not
// be used as map or database keys without first guaranteeing that the
// identical Location has been set for all values, which can be achieved
// through use of the UTC or Local method, and that the monotonic clock reading
// has been stripped by setting t = t.Round(0). In general, prefer t.Equal(u)
// to t == u, since t.Equal uses the most accurate comparison available and
// correctly handles the case when only one of its arguments has a monotonic
// clock reading.
//
// In addition to the required “wall clock” reading, a Time may contain an optional
// reading of the current process's monotonic clock, to provide additional precision
// for comparison or subtraction.
// See the “Monotonic Clocks” section in the package documentation for details.
//
type Time struct {
// wall and ext encode the wall time seconds, wall time nanoseconds,
// and optional monotonic clock reading in nanoseconds.
//
// From high to low bit position, wall encodes a 1-bit flag (hasMonotonic),
// a 33-bit seconds field, and a 30-bit wall time nanoseconds field.
// The nanoseconds field is in the range [0, 999999999].
// If the hasMonotonic bit is 0, then the 33-bit field must be zero
// and the full signed 64-bit wall seconds since Jan 1 year 1 is stored in ext.
// If the hasMonotonic bit is 1, then the 33-bit field holds a 33-bit
// unsigned wall seconds since Jan 1 year 1885, and ext holds a
// signed 64-bit monotonic clock reading, nanoseconds since process start.
wall uint64
ext int64

// loc specifies the Location that should be used to
// determine the minute, hour, month, day, and year
// that correspond to this Time.
// The nil location means UTC.
// All UTC times are represented with loc==nil, never loc==&utcLoc.
loc *Location
}

3. time的行为

  1. 构造时间-获取现在时间-time.Now(), time.Now()使用本地时间, time.Local即本地时区, 取决于运行的系统环境设置, 优先取”TZ”这个环境变量, 然后取/etc/localtime, 都取不到就用UTC兜底.

    func Now() Time {
    sec, nsec := now()
    return Time{sec + unixToInternal, nsec, Local}
    }
  1. 构造时间-获取某一时区的现在时间-time.Now().In(), Time结构体的In()方法仅设置loc, 不会改变时间值. 特别地, 如果是获取现在的UTC时间, 可以使用Time.Now().UTC().
    时区不能为nil. time包中只有两个时区变量time.Local和time.UTC. 其他时区变量有两种方法取得, 一个是通过time.LoadLocation函数根据时区名字加载, 时区名字见IANA Time Zone database, LoadLocation首先查找系统zoneinfo, 然后查找$GOROOT/lib/time/zoneinfo.zip.另一个是在知道时区名字和偏移量的情况下直接调用time.FixedZone("$zonename", $offsetSecond)构造一个Location对象.

    // In returns t with the location information set to loc.
    //
    // In panics if loc is nil.
    func (t Time) In(loc *Location) Time {
    if loc == nil {
    panic("time: missing Location in call to Time.In")
    }
    t.setLoc(loc)
    return t
    }

    // LoadLocation returns the Location with the given name.
    //
    // If the name is "" or "UTC", LoadLocation returns UTC.
    // If the name is "Local", LoadLocation returns Local.
    //
    // Otherwise, the name is taken to be a location name corresponding to a file
    // in the IANA Time Zone database, such as "America/New_York".
    //
    // The time zone database needed by LoadLocation may not be
    // present on all systems, especially non-Unix systems.
    // LoadLocation looks in the directory or uncompressed zip file
    // named by the ZONEINFO environment variable, if any, then looks in
    // known installation locations on Unix systems,
    // and finally looks in $GOROOT/lib/time/zoneinfo.zip.
    func LoadLocation(name string) (*Location, error) {
    if name == "" || name == "UTC" {
    return UTC, nil
    }
    if name == "Local" {
    return Local, nil
    }
    if zoneinfo != "" {
    if z, err := loadZoneFile(zoneinfo, name); err == nil {
    z.name = name
    return z, nil
    }
    }
    return loadLocation(name)
    }
  1. 构造时间-手动构造时间-time.Date(), 传入年元日时分秒纳秒和时区变量Location构造一个时间. 得到的是指定location的时间.

    func Date(year int, month Month, day, hour, min, sec, nsec int, loc *Location) Time {
    if loc == nil {
    panic("time: missing Location in call to Date")
    }
    .....
    }
  1. 构造时间-从unix时间戳中构造时间, time.Unix(), 传入秒和纳秒构造.
  2. 序列化反序列化时间-文本和JSON, fmt.Sprintf,fmt.SScanf, json.Marshal, json.Unmarshal时的, 使用的时间格式均包含时区信息, 序列化使用RFC3339Nano()”2006-01-02T15:04:05.999999999Z07:00”, 反序列化使用RFC3339()”2006-01-02T15:04:05Z07:00”, 反序列化没有纳秒值也可以正常序列化成功.

    // String returns the time formatted using the format string
    //"2006-01-02 15:04:05.999999999 -0700 MST"
    func (t Time) String() string {
    return t.Format("2006-01-02 15:04:05.999999999 -0700 MST")
    }
    // MarshalJSON implements the json.Marshaler interface.
    // The time is a quoted string in RFC 3339 format, with sub-second precision added if present.
    func (t Time) MarshalJSON() ([]byte, error) {
    if y := t.Year(); y < 0 || y >= 10000 {
    // RFC 3339 is clear that years are 4 digits exactly.
    // See golang.org/issue/4556#c15 for more discussion.
    return nil, errors.New("Time.MarshalJSON: year outside of range [0,9999]")
    }

    b := make([]byte, 0, len(RFC3339Nano)+2)
    b = append(b, '"')
    b = t.AppendFormat(b, RFC3339Nano)
    b = append(b, '"')
    return b, nil
    }

    // UnmarshalJSON implements the json.Unmarshaler interface.
    // The time is expected to be a quoted string in RFC 3339 format.
    func (t *Time) UnmarshalJSON(data []byte) error {
    // Ignore null, like in the main JSON package.
    if string(data) == "null" {
    return nil
    }
    // Fractional seconds are handled implicitly by Parse.
    var err error
    *t, err = Parse(`"`+RFC3339+`"`, string(data))
    return err
    }
  1. 序列化反序列化时间-HTTP协议中的date, 统一GMT, 代码位于net/http/server.go:878

    // TimeFormat is the time format to use when generating times in HTTP
    // headers. It is like time.RFC1123 but hard-codes GMT as the time
    // zone. The time being formatted must be in UTC for Format to
    // generate the correct format.
    //
    // For parsing this time format, see ParseTime.
    const TimeFormat = "Mon, 02 Jan 2006 15:04:05 GMT"
  1. 序列化反序列化时间-time.Format("$layout"), time.Parse("$layout","$value"), time.ParseInLocation("$layout","$value","$Location")

    • time.Format("$layout")格式化时间时, 时区会参与计算. 调time.Time的Year()Month()Day()等获取年月日等时时区会参与计算, 得到一个使用偏移量修正过的正确的时间字符串, 若$layout有指定显示时区, 那么时区信息会体现在格式化后的时间字符串中. 如果$layout没有指定显示时区, 那么字符串只有时间没有时区, 时区是隐含的, time.Time对象中的时区.
    • time.Parse("$layout","$value"), 若$layout有指定显示时区, 那么时区信息会体现在格式化后的time.Time对象. 如果$layout没有指定显示时区, 那么使用会认为这是一个UTC时间, 时区是UTC.
    • time.ParseInLocation("$layout","$value","$Location") 使用传参的时区解析时间, 建议用这个, 没有歧义.

      // Parse parses a formatted string and returns the time value it represents.
      // The layout defines the format by showing how the reference time,
      // defined to be
      //Mon Jan 2 15:04:05 -0700 MST 2006
      // would be interpreted if it were the value; it serves as an example of
      // the input format. The same interpretation will then be made to the
      // input string.
      //
      // Predefined layouts ANSIC, UnixDate, RFC3339 and others describe standard
      // and convenient representations of the reference time. For more information
      // about the formats and the definition of the reference time, see the
      // documentation for ANSIC and the other constants defined by this package.
      // Also, the executable example for time.Format demonstrates the working
      // of the layout string in detail and is a good reference.
      //
      // Elements omitted from the value are assumed to be zero or, when
      // zero is impossible, one, so parsing "3:04pm" returns the time
      // corresponding to Jan 1, year 0, 15:04:00 UTC (note that because the year is
      // 0, this time is before the zero Time).
      // Years must be in the range 0000..9999. The day of the week is checked
      // for syntax but it is otherwise ignored.
      //
      // In the absence of a time zone indicator, Parse returns a time in UTC.
      //
      // When parsing a time with a zone offset like -0700, if the offset corresponds
      // to a time zone used by the current location (Local), then Parse uses that
      // location and zone in the returned time. Otherwise it records the time as
      // being in a fabricated location with time fixed at the given zone offset.
      //
      // No checking is done that the day of the month is within the month's
      // valid dates; any one- or two-digit value is accepted. For example
      // February 31 and even February 99 are valid dates, specifying dates
      // in March and May. This behavior is consistent with time.Date.
      //
      // When parsing a time with a zone abbreviation like MST, if the zone abbreviation
      // has a defined offset in the current location, then that offset is used.
      // The zone abbreviation "UTC" is recognized as UTC regardless of location.
      // If the zone abbreviation is unknown, Parse records the time as being
      // in a fabricated location with the given zone abbreviation and a zero offset.
      // This choice means that such a time can be parsed and reformatted with the
      // same layout losslessly, but the exact instant used in the representation will
      // differ by the actual zone offset. To avoid such problems, prefer time layouts
      // that use a numeric zone offset, or use ParseInLocation.
      func Parse(layout, value string) (Time, error) {
      return parse(layout, value, UTC, Local)
      }

      // ParseInLocation is like Parse but differs in two important ways.
      // First, in the absence of time zone information, Parse interprets a time as UTC;
      // ParseInLocation interprets the time as in the given location.
      // Second, when given a zone offset or abbreviation, Parse tries to match it
      // against the Local location; ParseInLocation uses the given location.
      func ParseInLocation(layout, value string, loc *Location) (Time, error) {
      return parse(layout, value, loc, loc)
      }

      func parse(layout, value string, defaultLocation, local *Location) (Time, error) {
      .....
      }
  2. 序列化反序列化时间-go-sql-driver/mysql中的时间处理.
    MySQL驱动解析时间的前提是连接字符串加了parseTime和loc, 如果parseTime为false, 会把mysql的date类型变成[]byte/string自行处理, parseTime为true才处理时间, loc指定MySQL中存储时间数据的时区, 如果没有指定loc, 用UTC. 序列化和反序列化均使用连接字符串中的设定的loc, SQL语句中的time.Time类型的参数的时区信息如果和loc不同, 则会调用t.In(loc)方法转时区.

    • 解析连接字符串的代码位于parseDSNParams函数https://github.com/go-sql-driver/mysql/blob/master/dsn.go#L467-L490

      // Time Location
      case "loc":
      if value, err = url.QueryUnescape(value); err != nil {
      return
      }
      cfg.Loc, err = time.LoadLocation(value)
      if err != nil {
      return
      }
      // time.Time parsing
      case "parseTime":
      var isBool bool
      cfg.ParseTime, isBool = readBool(value)
      if !isBool {
      return errors.New("invalid bool value: " + value)
      }
    • 解析SQL语句中time.Time类型的参数的代码位于mysqlConn.interpolateParams方法https://github.com/go-sql-driver/mysql/blob/master/connection.go#L230-L273

      case time.Time:
      if v.IsZero() {
      buf = append(buf, "'0000-00-00'"...)
      } else {
      v := v.In(mc.cfg.Loc)
      v = v.Add(time.Nanosecond * 500) // To round under microsecond
      year := v.Year()
      year100 := year / 100
      year1 := year % 100
      month := v.Month()
      day := v.Day()
      hour := v.Hour()
      minute := v.Minute()
      second := v.Second()
      micro := v.Nanosecond() / 1000

      buf = append(buf, []byte{
      '\'',
      digits10[year100], digits01[year100],
      digits10[year1], digits01[year1],
      '-',
      digits10[month], digits01[month],
      '-',
      digits10[day], digits01[day],
      ' ',
      digits10[hour], digits01[hour],
      ':',
      digits10[minute], digits01[minute],
      ':',
      digits10[second], digits01[second],
      }...)

      if micro != 0 {
      micro10000 := micro / 10000
      micro100 := micro / 100 % 100
      micro1 := micro % 100
      buf = append(buf, []byte{
      '.',
      digits10[micro10000], digits01[micro10000],
      digits10[micro100], digits01[micro100],
      digits10[micro1], digits01[micro1],
      }...)
      }
      buf = append(buf, '\'')
      }
    • 从MySQL数据流中解析时间的代码位于textRows.readRow方法https://github.com/go-sql-driver/mysql/blob/master/packets.go#L772-L777, 注意只要MySQL连接字符串设置了parseTime=true, 就会解析时间, 不管你是用string还是time.Time接收的.

      if !isNull {
      if !mc.parseTime {
      continue
      } else {
      switch rows.rs.columns[i].fieldType {
      case fieldTypeTimestamp, fieldTypeDateTime,
      fieldTypeDate, fieldTypeNewDate:
      dest[i], err = parseDateTime(
      string(dest[i].([]byte)),
      mc.cfg.Loc,
      )
      if err == nil {
      continue
      }
      default:
      continue
      }
      }

      }

4. time时区处理不当案例

  1. 有个服务频繁使用最新汇率, 所以缓存了最新汇率对象, 汇率对象的过期时间设为第二天北京时间零点, 汇率过期则从数据库中去最新汇率, 设置过期时间的代码如下:

    var startTime string = time.Now().UTC().Add(8 * time.Hour).Format("2006-01-02")
    tm2, _ := time.Parse("2006-01-02", startTime)
    lastTime = tm2.Unix() + 24*60*60

    这段代码使用了time.Parse, 如果时间格式中没有指定时区, 那么会得到使用本地时区下的第二天零点, 服务器时区设置为UTC0, 于是汇率缓存在UTC零点即北京时间八点才更新.

  2. 公共库中有一个GetBjTime()方法, 注释写着将服务器UTC转成北京时间, 代码如下

    // 原版
    func GetBjTime() time.Time {
    // 将服务器UTC转成北京时间
    uTime := time.Now().UTC()
    dur, _ := time.ParseDuration("+8h")
    return uTime.Add(dur)
    }
    // 改
    func GetBjTime() time.Time {
    // 将服务器UTC转成北京时间
    uTime := time.Now()
    return uTime.In(time.FixedZone("CST", 8*60*60))
    }

    同事用这个方法将得到的time.Time参与计算, 发现多了8个小时. 觉得有问题, 同事和我讨论了之后, 我们得出结论后就大意地直接把原有函数改了, 我们都没有意识到这是个非常危险操作, 只所以危险是因为这个函数已经在很多服务的代码里用着(要稳!不能乱动公共库!!!). 之前用这个函数是因为老Java项目运行在时区为东八区的系统上, 大量代码使用东八区时间, 但数据库MySQL时区设置为UTC, go项目也运行在UTC时区. 也就是说, Java项目在把时区为UTC数据库当做是东八区来用, Java程序往MySQL写东八区的时间字符串, 在sequel软件中看表内容时虽然字符串是一样的, 但其实内部是UTC的时间, go代码的mysql连接字符串中loc选项为空, 就会使用UTC时区去解析数据, 拿到的数据会多八个小时. 例如Java代码往mysql插入一条”2017-10-29 22:00:00”数据本意是东八区2017年10月29日22点, 但在MySQL内部看来, 这是UTC的2017年10月29日22点, 换算成东八区时间为2017年10月30日6点, 如果其它程序解析时认为时间数据是MySQL的UTC时区, 那么会得到一个错误的时间. 所以才会在GO中要往Java代码创建的表写入数据时用time.Now().UTC().Add(time.Hour*8)直接相加八小时使得Java项目行为一致, 拿UTC的数据库存东八区时间.

    后面想想, 面对这种数据库中有时区不一致数据的情况, 在没有办法统一UTC时区的情况下, 应当使用MySQL时间字符串而不是time.Time来传递以避免时区隐含转换问题, 写入时参数传string类型的时间字符串, 解析时先拿到时间字符串, 然后自行判断建表时这个字段用的是东八区的时间字符串还是UTC时间字符串进行time.ParseInLocation得到时间对象, MySQL连接字符串的parseTime选项要设置为false. 比如我想在MySQL中存东八区的当前时间, SQL参数用Format后的字符串而不是传time.Time, 原版的time.Now().UTC().Add(time.Hour*8).Format("2006-01-02 15:04:05")和修改的time.Now().In(time.FixedZone("CST", 8*60*60))的输出将是一样, 但后者是正确的东八区现在时间. 原版的GetBjTime()返回time.Time可能用GetBeijingNowTimeString返回string更能体现本意吧.

5. 时间有关的标准

  • UTC

    协调世界时(英语:Coordinated Universal Time,法语:Temps Universel Coordonné,简称UTC)是最主要的世界时间标准,其以原子时秒长为基础,在时刻上尽量接近于格林尼治标准时间。中华民国采用CNS 7648的《资料元及交换格式–资讯交换–日期及时间的表示法》(与ISO 8601类似)称之为世界协调时间。中华人民共和国采用ISO 8601:2000的国家标准GB/T 7408-2005《数据元和交换格式 信息交换 日期和时间表示法》中亦称之为协调世界时。
    协调世界时是世界上调节时钟和时间的主要时间标准,它与0度经线的平太阳时相差不超过1秒[4],并不遵守夏令时。协调世界时是最接近格林威治标准时间(GMT)的几个替代时间系统之一。对于大多数用途来说,UTC时间被认为能与GMT时间互换,但GMT时间已不再被科学界所确定。

  • ISO 8601 计算某一天在一年的第几周/循环时间RRlue/会用到此标准

    国际标准ISO 8601,是国际标准化组织的日期和时间的表示方法,全称为《数据存储和交换形式·信息交换·日期和时间的表示方法》。目前是第三版“ISO8601:2004”以替代第一版“ISO8601:1988”与第二版“ISO8601:2000”。

  • UNIX时间

    UNIX时间,或称POSIX时间是UNIX或类UNIX系统使用的时间表示方式:从协调世界时1970年1月1日0时0分0秒起至现在的总秒数,不考虑闰秒[1]。 在多数Unix系统上Unix时间可以通过date +%s指令来检查。

  • 时区

    时区列表

Linux Cli下酷工具收集(持续)

作者 hanjm
2017年5月6日 00:00
  1. mycli. ipython之于Python, mycli之于mysql. 当然还有pgcli. Python写的工具. mycli Github地址:https://github.com/dbcli/mycli
  2. youtube-dl. youtube下载器, 能直接下载youtube视频列表. Python写的工具.
  3. oh-my-zsh的z命令. 手动输入一个很长的路径名不停地tab很麻烦, 配置了oh-my-zsh的话可以启用z命令(edit: ~/.zshrc line: plugins=(git python z tmux)), z 文件夹名 就可以跳转到常用目录中最符合输入文件夹名的文件夹中, 非常方便, GitHub地址https://github.com/robbyrussell/oh-my-zsh
  4. privoxy. brew pip npm install、docker pull总是慢如蜗牛? privoxy能将shadowsocks的socks代理(127.0.0.1:1080)转换为http/https代理, 有个奇特的地方是把它把文档写在配置文件的注释里, config文件有2271行, 初让人以为配置起来会巨复杂, 实际上基本的功能两行配置即可. listen-address配置为0.0.0.0:8118, 局域网内其他设备也可以走此代理:8118. 官网https://www.privoxy.org/

    listen-address  0.0.0.0:8118
    forward-socks5 / localhost:1080 .

    然后在.zshrc或.bashrc中加入一下命令就可以通过proxy dproxy来切换是否在本终端下使用代理了.

    function proxy(){
    export http_proxy=http://127.0.0.1:8118
    export https_proxy=https://127.0.0.1:8118
    }
    function dproxy(){
    unset http_proxy
    unset https_proxy
    }
  5. kcptun. bandwagon上的shadowsocks越来越慢, 不用kcptun加速没法正常使用, 只能不太厚道地超量发包了. GitHub地址https://github.com/xtaci/kcptun

Go strings.TrimLeft() strings.TrimPrefix().md

作者 hanjm
2017年4月24日 00:00

今天在调试时, 有个函数的返回的结果很奇怪, 和预期的输入差了一个字符, 而review代码时却没发现什么问题, 后面各种加logger.Debugf()才发现是strings.TrimLeft()这个函数表现得和自己的预期不一致, 从函数名上看这个是删除字符串左边的字符串, 但是传入一个带:的字符串去调用,发现:后面的字符也被Trim了, 于是去Github issues上搜了下这个问题https://github.com/golang/go/issues/19371, 有人也感觉奇怪也反馈过, 解释是 The second argument to Trim is a set of code points, not a prefix/suffix. , 于是去翻了下文档, 确实是这样的.

TrimLeft returns a slice of the string s with all leading Unicode code points contained in cutset removed.

问题复现代码(go 1.8) https://play.golang.org/p/YtmVQIf2_i:

package main

import (
"fmt"
"strings"
)

func main() {
str := "friends:d15fc7bb-1e67-11e7-b8a5-00163e008796"
prefix1 := "friends:"
prefix2 := "friends"
fmt.Printf("%v\n", strings.TrimLeft(str, prefix1))
fmt.Printf("%v\n", strings.TrimPrefix(str, prefix1))
fmt.Printf("%v\n", strings.TrimLeft(str, prefix2))
fmt.Printf("%v\n", strings.TrimPrefix(str, prefix2))
}

output:

15fc7bb-1e67-11e7-b8a5-00163e008796
d15fc7bb-1e67-11e7-b8a5-00163e008796
:d15fc7bb-1e67-11e7-b8a5-00163e008796
❌
❌